1. The reflex that costs a month
The chart turns down on a Tuesday. By Wednesday there is a story in the room. Someone remembers a thin content page. Someone else says the last core update was two weeks ago. A third person wants to disavow links. By Friday the team is writing a recovery plan for a penalty that may not exist.
I have sat in that room. I have also been the person who spent three weeks rewriting content because a drop looked like a quality problem, when the cause was a title template that had lost its brand suffix.
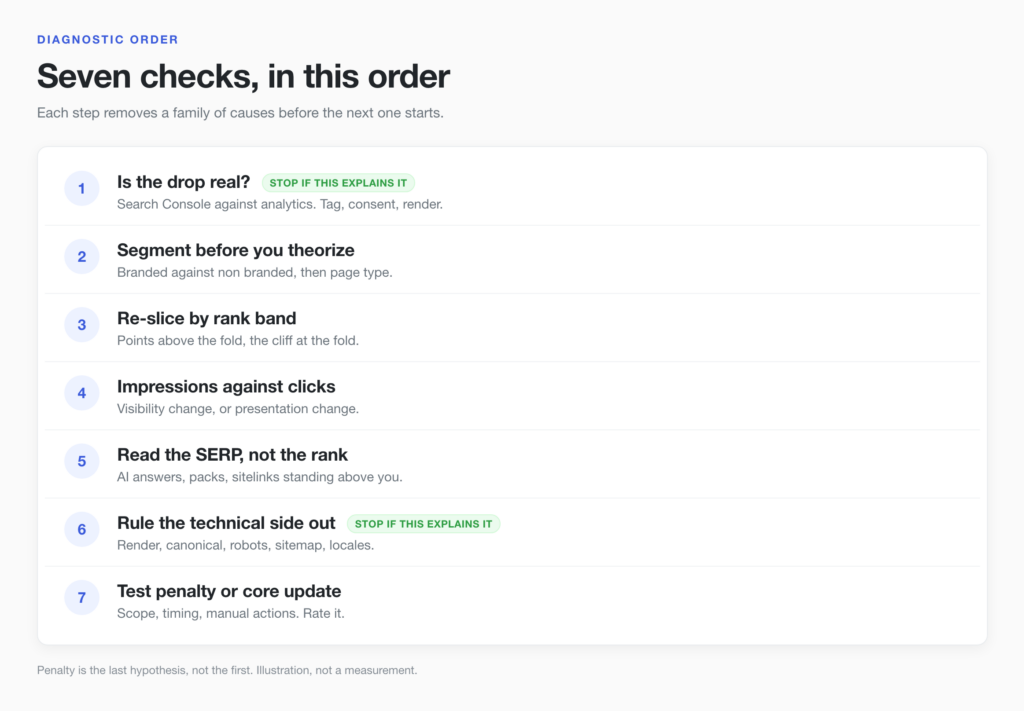
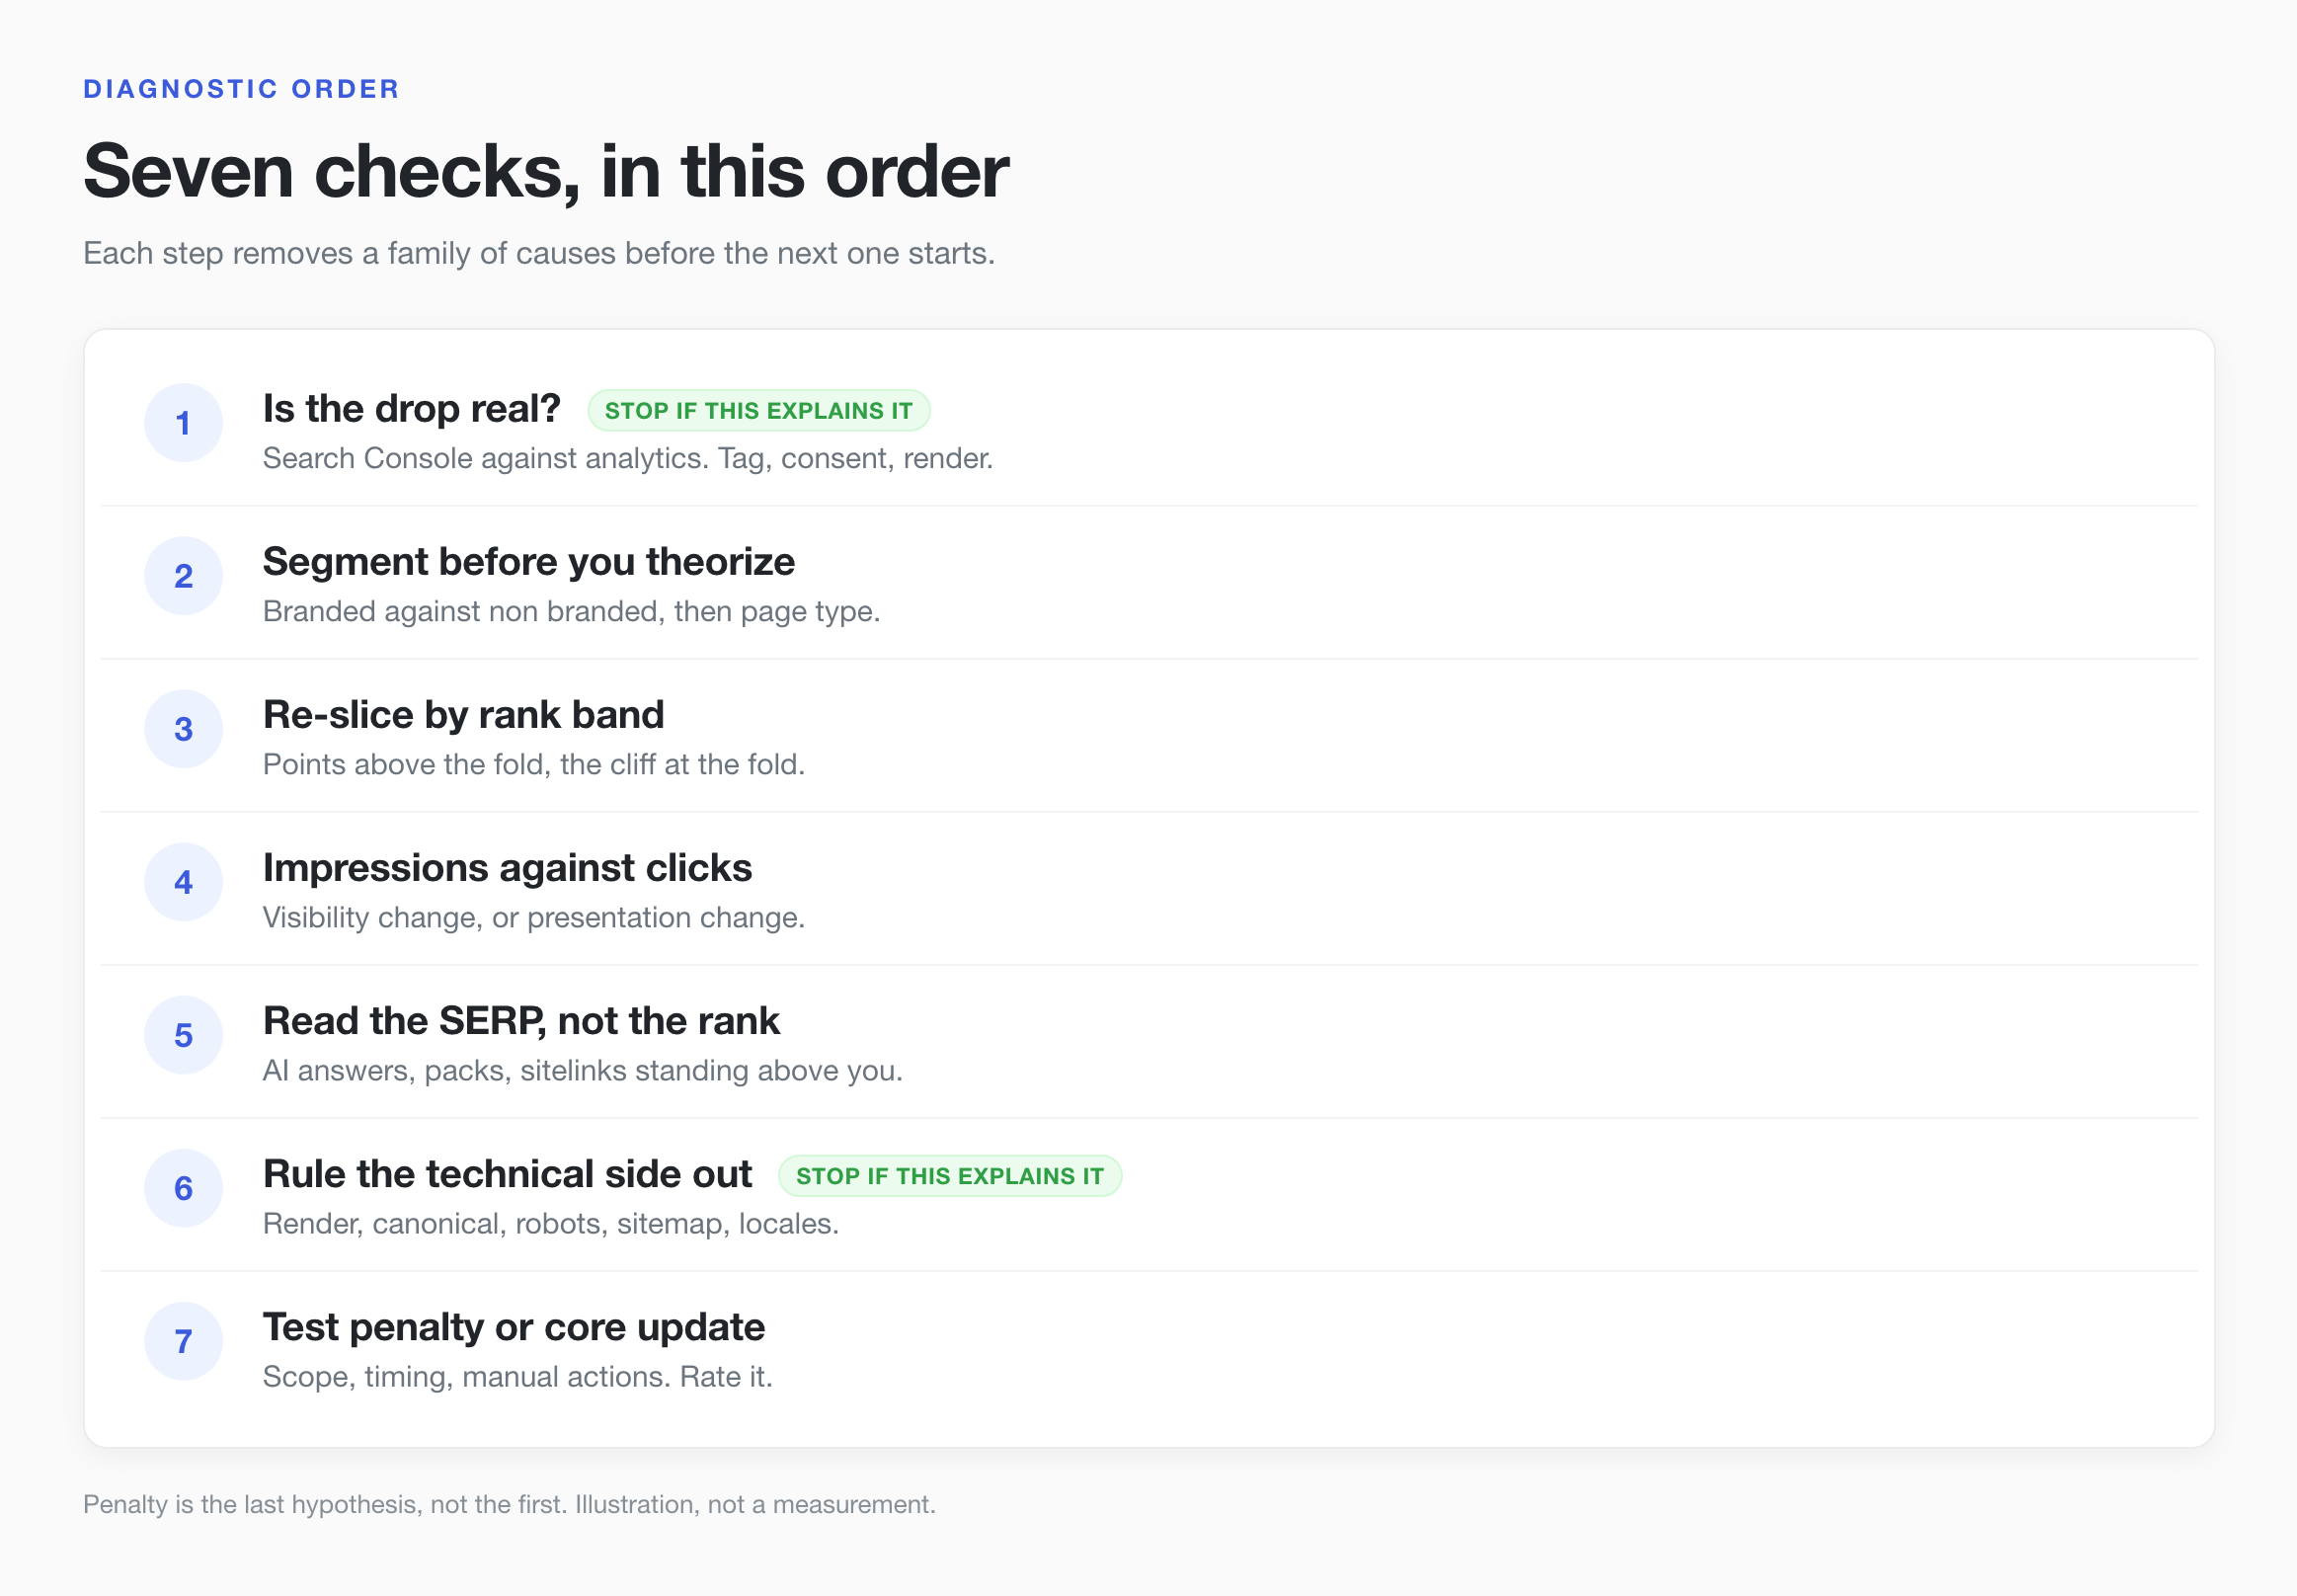
Most traffic drops are not penalties. They are position maths, SERP layout, or measurement. The order you check things in matters more than the depth of any single check, because each step is designed to eliminate a whole family of causes before you spend a month on the wrong one. This is the order I use. It is not a theory about how ranking works. It is a sequence that stops me from fixing something that was never broken.
2. Step 1: Is the drop real?
Before any SEO explanation, confirm that the drop is real and that you are measuring the same thing you measured last month.
Start with the tag. A container change, a consent banner that now fires before the page view, a single page template that stopped sending events, or a bot filter switched on in the reporting tool will all draw a cliff that looks exactly like a ranking collapse. Compare Search Console clicks with your analytics sessions for the same period. If Search Console is flat and analytics is down, the ranking did not move. Your measurement did.
Then check the Search Console side. Google publishes a data anomalies page for known logging and processing problems, and it is worth reading before you read your own chart. I have seen a week of apparent loss explained by a logging error that was already documented.
Only when both sources agree that fewer people arrived do you have an SEO problem to diagnose.
3. Step 2: Segment before you theorize
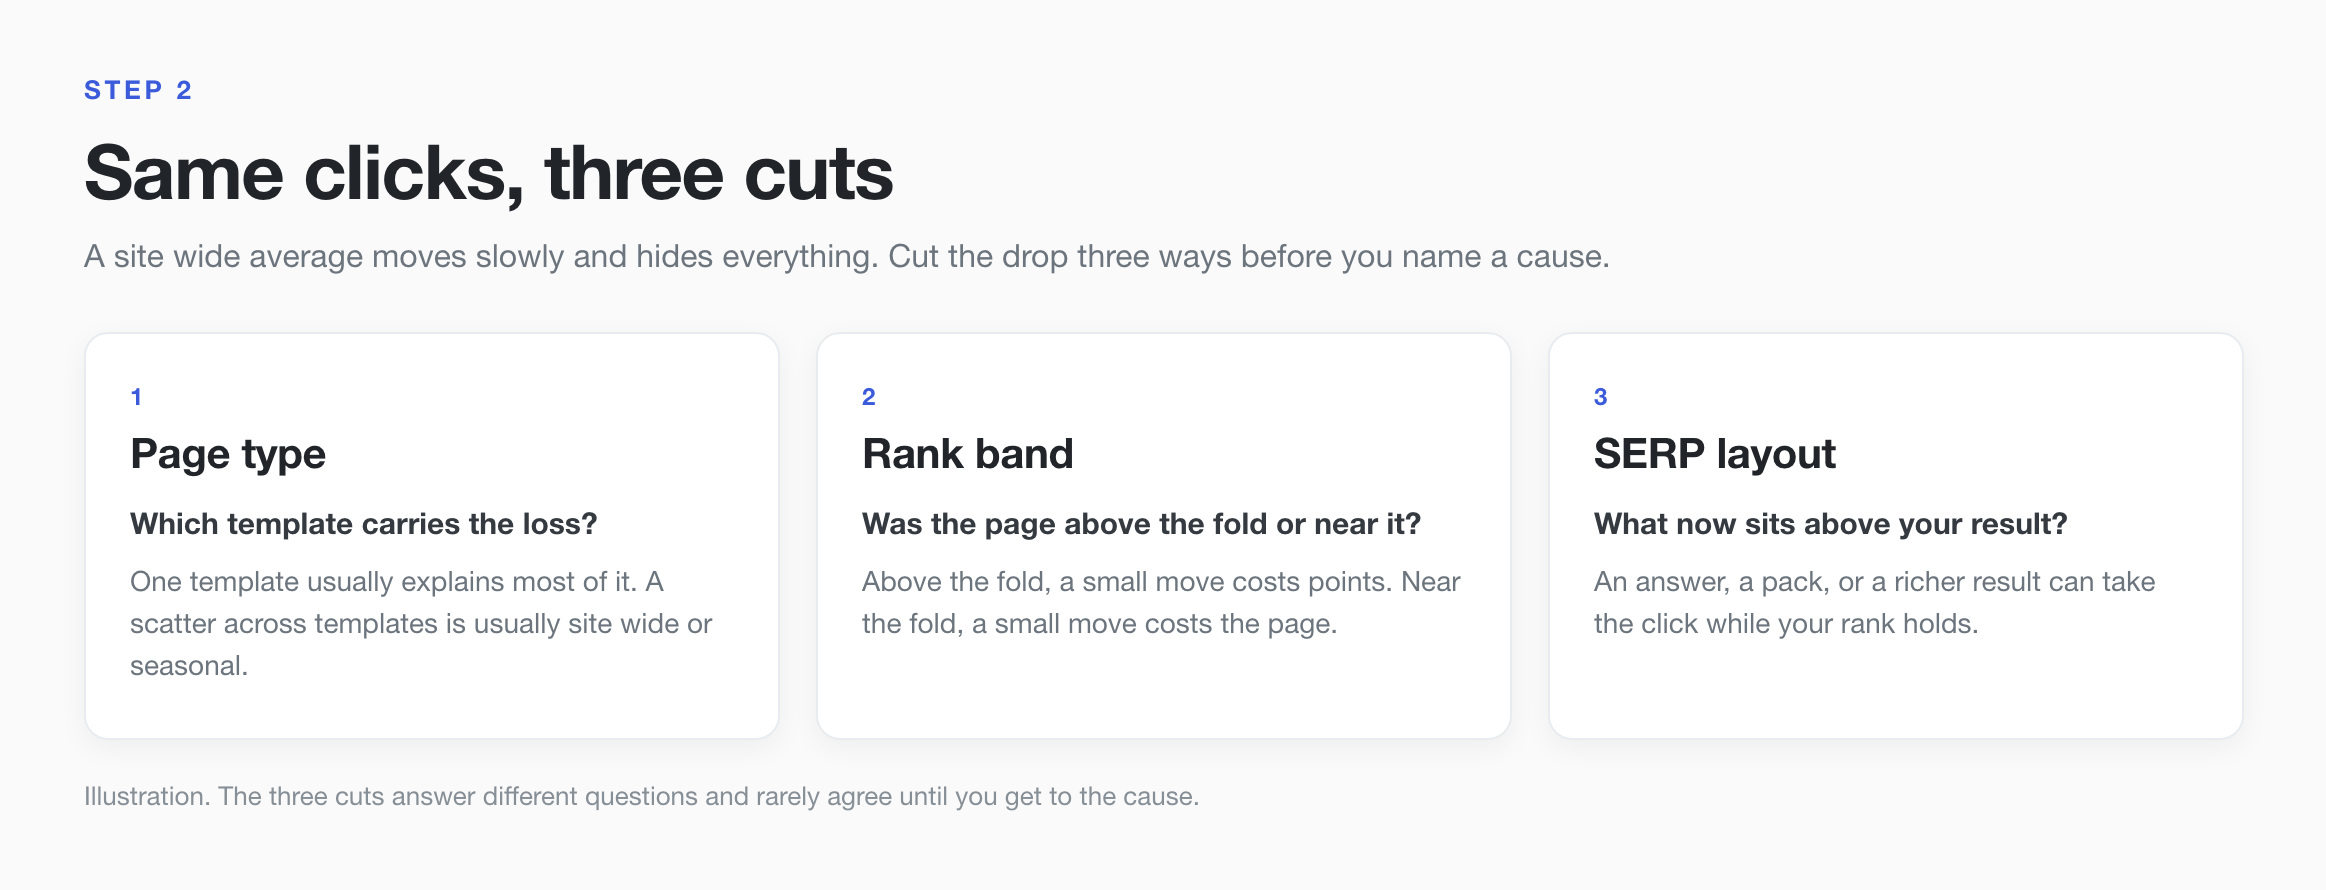
A site wide average is the least useful number here. It moves slowly, hides everything, and invites exactly the theory that burns weeks.
Split the drop two ways.
Branded against non branded. Branded clicks come from people who already know you. A fall in branded clicks is usually demand, a brand problem, or a tracking problem. A fall in non branded clicks is usually the search result. If the whole drop sits in one of those two buckets, you have already halved the search space.
Page type against page type. Group by template, not by URL: product pages, category pages, editorial pages, help pages, localised pages. In my experience one template explains most of a real drop. That is good news, because a template can be inspected in an afternoon. A scatter of unrelated pages losing traffic is usually something site wide or seasonal.
4. Step 3: Re-slice by rank band
Now take the same clicks and cut them by the position the page was sitting in. This is the step people skip, and it is the one that separates a positional effect from a penalty.
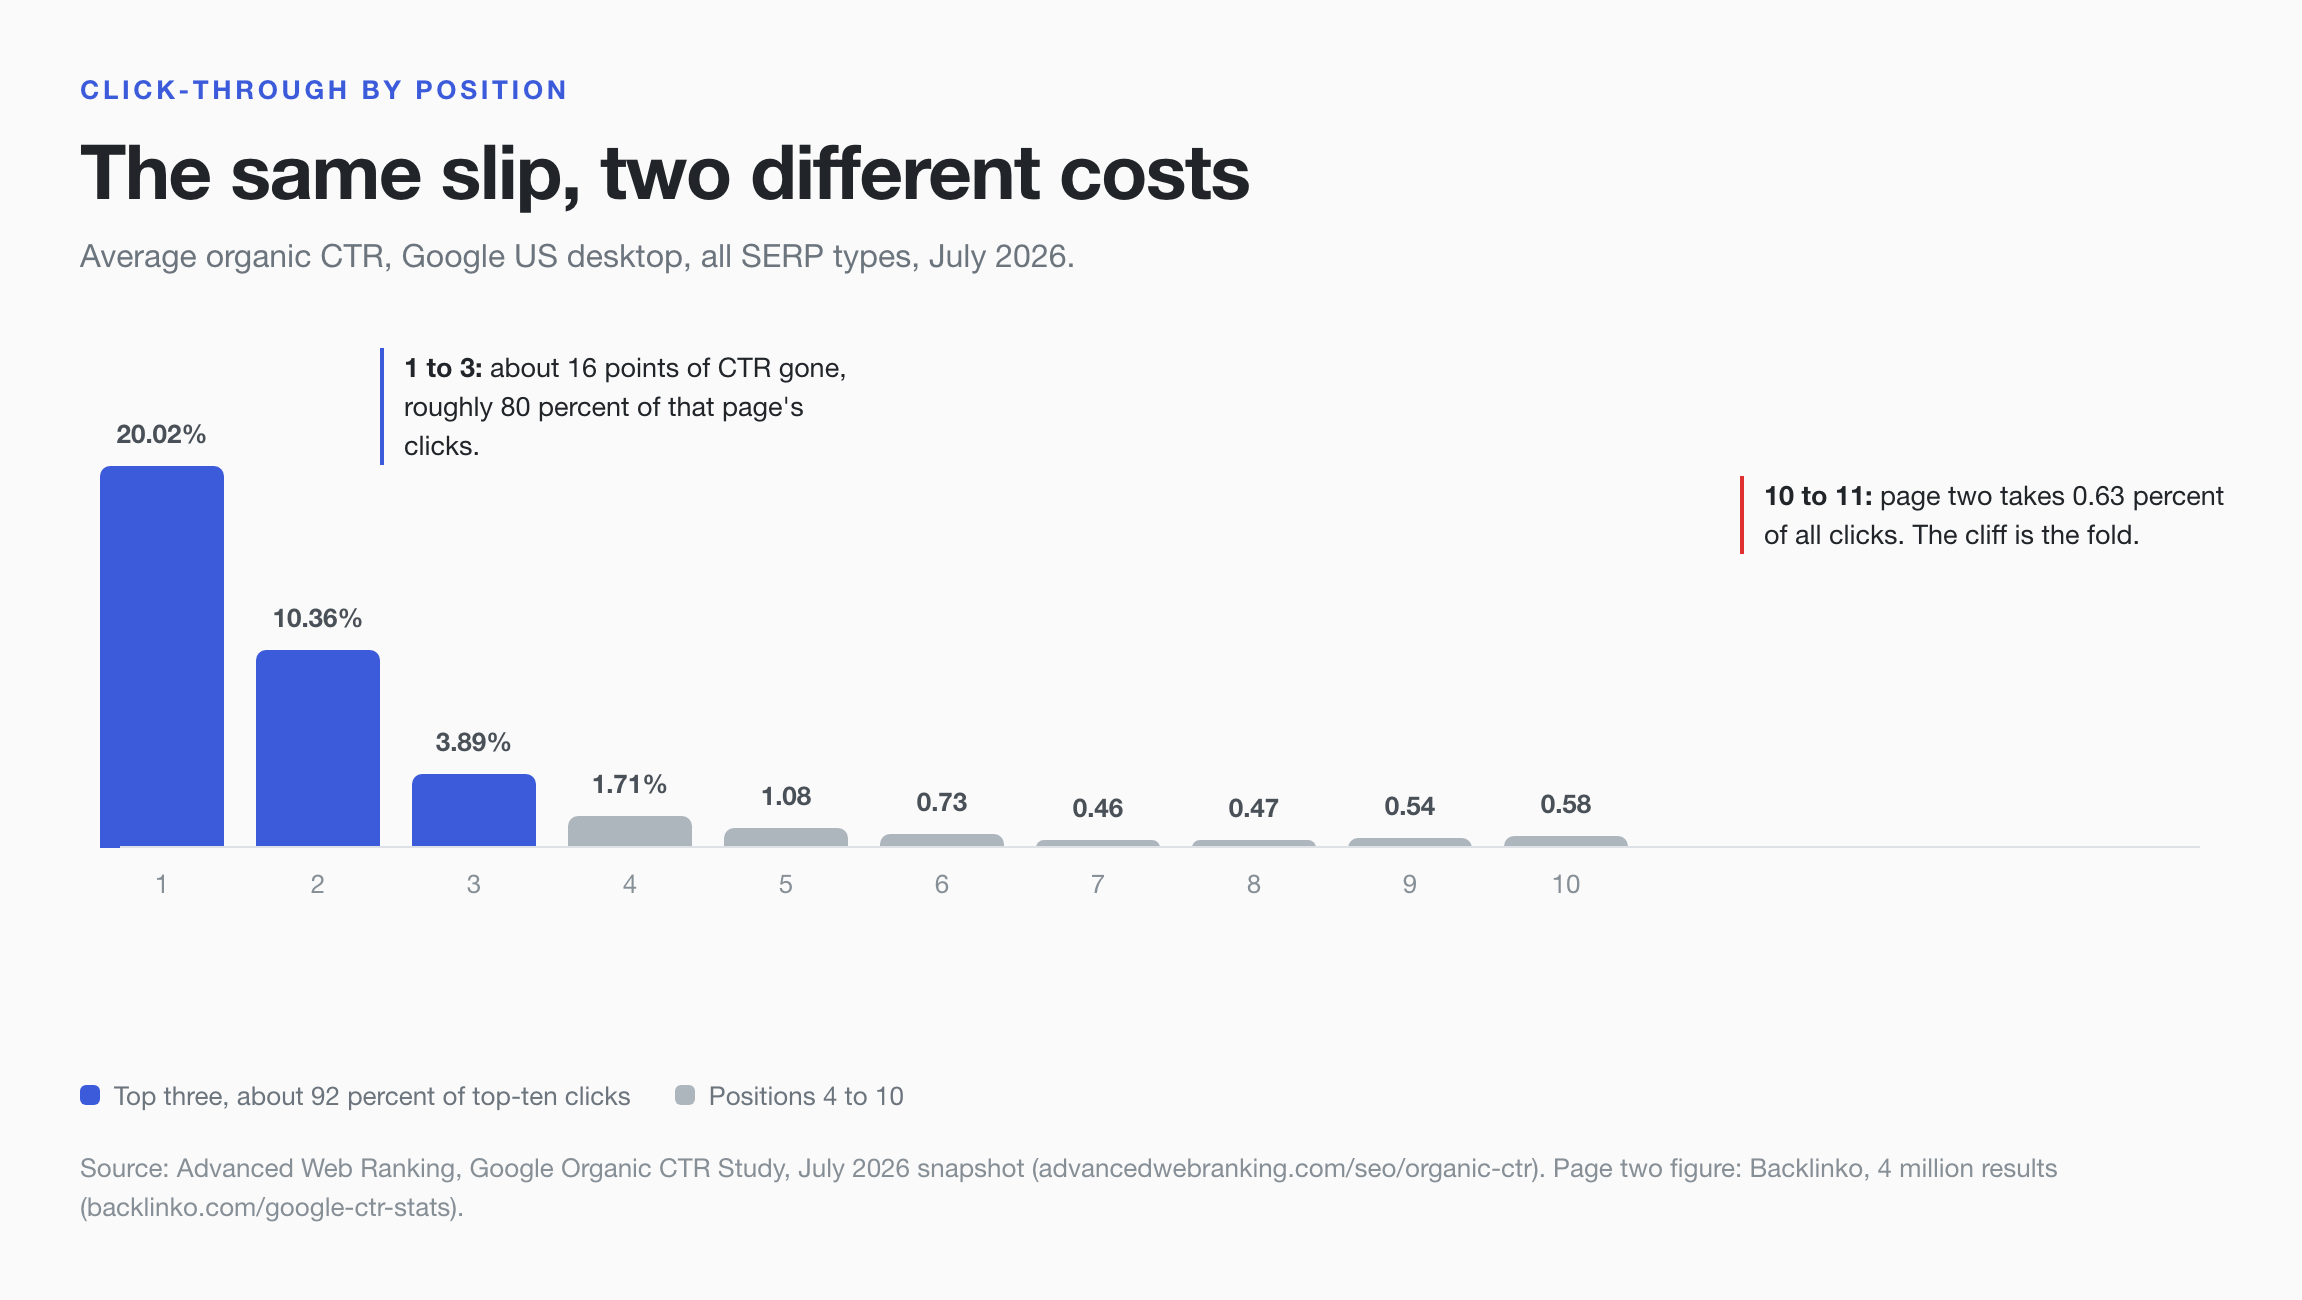
Public CTR data is clear about the shape of the curve. In Advanced Web Ranking’s July 2026 snapshot for Google US desktop, across all SERP types, the average organic result earned 20.02 percent CTR at position 1, 10.36 percent at position 2, and 3.89 percent at position 3. Positions 1 to 3 collected roughly 92 percent of all clicks that reached the top ten results in that sample. Backlinko’s study of about 4 million results found the same shape from a different dataset: 27.6 percent at position 1, 54.4 percent of all clicks going to the top three, and only 0.63 percent of searchers clicking anything on page two.
Read those numbers twice, because they support two arguments and people usually pick the wrong one.
The absolute argument. A two place slip at the top is expensive in raw points. Going from 1 to 3 in the AWR data is roughly 16 points of CTR gone. The same slip from 7 to 9 costs a fraction of a point, because there is only a fraction of a point left to lose. Near the top, small positional moves cost real traffic, quietly, because the impression count barely changes.
The relative argument. Near the fold the risk is not points, it is a cliff. AWR’s data shows positions 7 to 10 sitting close together, all under about 0.6 percent, so an 8 to 9 move changes almost nothing. A 10 to 11 move crosses onto page two, which takes well under 1 percent of clicks in Backlinko’s dataset. The intuition that the same slip hurts more at 7 to 8 than at 1 to 3 is therefore right, but not for the reason people give. It hurts more because the boundary is close, not because the curve is steeper there.
Both readings are positional effects, and neither is a penalty. A penalty is a judgement about your site. A positional effect is arithmetic about where the page sits. The rank band split tells you which one you have.
One caution on the data itself. Average position in Search Console is impression weighted and bucketed, so it moves when the query mix moves. A page whose average position goes from 4.2 to 6.8 may not have lost any query at all. It may have gained impressions for queries where it sits at 15. Segment by query before you trust the average.
5. Step 4: Impressions against clicks
This single comparison removes most of the remaining ambiguity.
If impressions fell with clicks, the page is being shown less often. That is a visibility or demand problem: ranking loss, deindexing, a lost featured slot, a seasonal fall, or a market that simply searched less. Google’s traffic drop guidance separates a small drop in position, their example is 2 to 4, from a large one, their example is 4 to 29. The second justifies looking at the site as a whole.
If impressions held and clicks fell, the page is still being shown and people stopped choosing it. Google is explicit about the first thing to check in that case: the title and the snippet, and whether a competing rich result now looks more useful. I would add two more: a new SERP feature above you that answers the query in place, and a template change that broke how the title renders in the result.
6. Step 5: Read the SERP, not the rank
You cannot diagnose a click problem from a rank tracker. You have to look at the page the searcher actually saw.
Take your top twenty losing queries and open the SERP for each one. Look for what appeared that was not there before: an AI generated answer, a shopping unit, a local pack, a video block, a people also ask expansion, sitelinks on a competitor, a knowledge panel that now answers the intent outright. None of these change your position. All of them change how many people reach your position.
AWR’s feature stacking analysis makes the size plain. In their sample an AI Overview alone cost the position 1 result 36 percent of its clicks, and stacked features took that much further. Their July 2026 data reports 74.3 percent of AI Overview SERPs ending without a single organic click, against 53.6 percent without one. You do not have to accept every number to accept the mechanism. Your rank stayed put. The page above you got better at answering.
This is where the segments from step 2 pay off. Feature damage is rarely uniform: informational queries lose far more than transactional ones, branded holds up better than unbranded, and desktop and mobile are not living in the same year. If your drop sits exactly where a feature sits, you have your cause.
7. Step 6: Rule the technical side in or out
Before you accept any algorithmic story, close the technical door. It is a short list and each item takes minutes.
Rendering. Fetch a sample of affected URLs as a crawler sees them, and confirm the content, canonical and robots directives survive without JavaScript assumptions that break on a mobile user agent.
Canonical and indexability. A template that started emitting a canonical to a different URL, or a noindex that shipped with a release, removes pages from results with no warning in any dashboard. Check the page indexing report for a step change, not a backlog.
Robots and sitemaps. A blocked path, a stale sitemap, or a WAF rule that now challenges the crawler produce a slow bleed rather than a cliff, which is why they get missed.
Locale pages, checked separately. This one deserves its own line because localised URLs fail differently from the rest of the site: translated bodies under English titles, untranslated metadata, hreflang and canonical pointing at each other, machine translation errors that change the meaning of a query match. If the drop is concentrated in one language, treat it as a localisation problem first. I wrote the checks I use into a separate piece, A Launch Gate for Multilingual SEO, so I will not repeat them here.
8. Step 7: Only now test the penalty or core update hypothesis
By this point you should have a specific, falsifiable claim rather than a feeling. Testing it is straightforward, and it is the step most teams start with.
Scope first. Is the loss site wide, one template, one language, one section, or one page? Google’s core update documentation treats a broad, sustained loss across many queries differently from a small move on individual pages, and recommends a site level self assessment only in the first case. A drop confined to one template is a template problem, whatever the calendar says.
Timing second. Check the Search Status Dashboard for the start and end date of any rollout. Google’s guidance is to wait a full week after an update completes, then compare that week with a week before the rollout began. If your drop started three weeks before any announced update, the update is not the cause, however convenient the story is.
Manual actions third. This is one click and it settles what argument cannot. If the report is empty, you are not dealing with a manual penalty, and most drops are not.
Then write the hypothesis down with a confidence level and a test. That is the difference between a diagnosis and a narrative.
9. Rating a hypothesis instead of arguing about it
I use four columns. The last two are what stop a team from committing a month to a guess.
| Signal | What it suggests | Confidence | What would confirm it |
|---|---|---|---|
| Impressions flat, clicks down, position stable | SERP layout or CTR change | Low on its own | A before and after view of the SERP for the top losing queries |
| Impressions down, clicks down, one template only | Template level visibility loss | Medium | Same pattern in every URL of that template, no pattern elsewhere |
| Position slipped 1 to 2 places, impressions nearly flat, loss concentrated above the fold | Positional effect | Medium | Band level CTR maths that explains the click loss without a penalty |
| Site wide loss across templates and languages, timing matches a completed rollout | Algorithmic reassessment | Medium | A second independent source agreeing, plus a verified rollout window |
| Site wide loss plus a manual action or a security flag | Policy issue | High | The Search Console report itself, plus the documented fix |
The rule for confidence is deliberately strict. High requires a second independent source to agree, not a second colleague. Medium means the segment pattern fits but the timing does not, or the timing fits but the pattern is thin. Low means a single metric moved. If everything you have is low, the honest answer is that you have not diagnosed anything yet, and the correct next action is another segment, not a rewrite.
10. Three drops that were not penalties
These are composites of patterns I have seen, with figures kept deliberately round and illustrative.
The slip dressed as a penalty. Clicks fall by about half. Impressions are almost unchanged. Average position has moved from roughly 4 to roughly 7. No manual action, no index coverage change, no release. Nothing is broken. The pages sat close to the fold, and a two to three place slip at that depth removes most of the clicks a page at that depth had. The fix is not a content audit. It is deciding whether those queries are worth competing for.
The feature that ate the click. Impressions are flat. Average position is flat, sometimes better. Clicks are down by a third. The queries that lost are informational, and the queries that held are transactional. A generative answer now sits above the results for exactly the losing set. There is no fault to find and no update to blame. The response is a different question: which of these queries still produce a click at all, and what would make your result the one worth clicking below the answer.
The measurement break. Analytics sessions fall sharply, Search Console clicks do not move, and the search result never changed. A consent banner started blocking the page view, a template stopped sending the event, or a filter was switched on. The right response is a tag fix and an apology to whoever already started the content audit.
All three look identical on a revenue chart. They need three different responses, and only one of them involves content.
11. What I would do on Monday morning
When a drop lands on my desk, this is the sequence, with nothing skipped.
- Export Search Console clicks and impressions for the last 16 months, so the drop sits next to last year.
- Compare the same window in analytics. Confirm both sources agree before reading anything else.
- Split branded from non branded, then by template. Name the segment that carries the loss.
- Split that segment by rank band, doing the points and the cliff maths separately.
- Check impressions against clicks, and write down which one you have.
- Open the SERP for the ten biggest losing queries. Note every feature that was not there three months ago.
- Run the technical list: rendering, canonical, robots, sitemap, locale pages.
- Check manual actions and the status dashboard. Note the drop date and any rollout end date.
- Write the hypothesis in one sentence, rate it, and name the test that would change your mind.
That pass takes an afternoon, and it is the only way I know to stop a positional effect being treated as a verdict on your site.
The rank band maths is not the interesting part of SEO. It is the part that keeps you from spending a month being interesting about the wrong thing.