If you’re an in-house SEO and your current process looks like running Lighthouse on a couple of URLs, putting the recommendations in a document, and sending them to your platform team, I would highly recommend stopping it. Here are key takeaways from my experience working with the platform team at Headout to improve our page experience from “Needs Improvement” to “Good”. Notice I’ve carefully written “experience” over “speed”.
Why Page Experience Matters for SEO
Before diving into the specifics, it’s important to understand why page experience is crucial for SEO. Google has made it clear that page experience is a ranking factor, i. A good page experience not only helps with rankings but also improves user engagement, reduces bounce rates which are all baked in the ranking algo.
Try Lighthouse/PageSpeed Insights Alternatives
Stop obsessing over the 100 score that Lighthouse or PageSpeed Insights throws. While these scores can be useful for getting buy-in from management, they don’t always reflect real-world performance, and platform engineers won’t find them actionable if you’re doing a straight copy paste job.
Instead, explore more comprehensive tools:
- WebPageTest: Offers detailed waterfall charts, filmstrip views, and the ability to test from multiple locations.
- GTmetrix: Provides in-depth performance reports and recommendations.
These tools offer features particularly useful for SEOs:
- Simulating different network conditions
- Analyzing performance across multiple pages
- Identifying render-blocking resources
For example, WebPageTest’s filmstrip view can help you visualize exactly when content becomes visible to users, which is crucial for understanding metrics like Largest Contentful Paint (LCP).
If you can buy webpagetest pro, do run their “experiments” in their sandbox environment
Understand the Implications of TTFB on LCP, FCP
To really grasp page performance, you need to understand how different metrics interact. Let’s break down some key terms:
- TTFB (Time to First Byte): The time it takes for a browser to receive the first byte of response from the server.
- FCP (First Contentful Paint): The time when the browser renders the first bit of content from the DOM.
- LCP (Largest Contentful Paint): The time when the largest content element in the viewport becomes visible.
If your FCP shows 4.2s on reporting tools and TTFB is 2s, then understand that the FCP is inclusive of TTFB. So, just resolving TTFB and bringing it to under 800ms (reducing 1200ms) could potentially bring your FCP to around the 3-second mark (4.2s – 1.2s = 3s).
Note: This 1:1 reduction is hypothetical, the real world will be less than it but that cascade to other metrics like LCP
Check For CDN Hits/Misses
Speaking of CDNs, it’s crucial to understand how they work and monitor their performance. A Content Delivery Network is a group of geographically distributed servers that work together to provide fast delivery of Internet content.
Many CDNs have a cache budget on a Least Recently Used (LRU) basis. This means large sites cannot expect all pages to load fast even if they’re of the same type/template. Your CDN might dump less frequently accessed pages from its cache, meaning subsequent requests for these pages will have to go back to the origin server, adding a round-trip delay.
To optimize CDN usage:
- Monitor cache hit ratios
- Implement intelligent cache-purging strategies around expiry dates etc
- Consider using multi-tiered caching architectures or an origin shield
Tools like CDN-specific dashboards or third-party monitoring solutions can help you keep an eye on CDN performance.
Obsess Over CRuX/RUM Scores
While synthetic testing tools are useful, real-user data is invaluable. Focus on:
- CrUX (Chrome User Experience Report): Provides user experience metrics for how real-world Chrome users experience popular destinations on the web.
- RUM (Real User Monitoring): Captures and analyzes every transaction of every user of your website or application.
For SEO purposes, CrUX data is particularly important as it’s a component that goes into Google’s ranking algorithm. However, be aware that CrUX data is limited to Chrome users, so complementing it with RUM data can provide a more comprehensive picture.
To get started with CrUX data:
- Set up a CrUX dashboard on Looker Studio. Here’s a template link.
- Use the Chrome extension by Jordy Scholing for quick insights for any website (competitors too :p )
For RUM, consider solutions offered by CDN providers (like Akamai mPulse) or standalone tools like New Relic.
Talk to Chrome WebDev Folks
The web development community, especially those working on Chrome, can be an invaluable resource. They’re often receptive to questions and generous with their knowledge. Some recommended accounts to follow on Twitter include:
- @patrickmeenan (Creator of WebPageTest)
- @bluesmoon (Performance expert)
- @addyosmani (Engineering Manager at Google working on Chrome)
- @tunetheweb (Web Performance Developer Advocate)
When reaching out, make sure you’ve done your research first and have specific, well-formulated questions.
Things I’m Currently Working On
- INP (Interaction to Next Paint) metrics: This is a new Core Web Vital that measures responsiveness. I’m exploring how to track elements responsible for poor scores. The Debug Bear INP debugger has been helpful for getting started with this.
- Server-side A/B experiment setups: These can help reduce initial TTFB for clients by moving the decision-making process to the server, potentially improving performance.
If you’re interested in getting updates about these projects or have questions about implementing these strategies, feel free to follow me at @siddhesh_asawa.
Remember, improving page experience is an ongoing process. Stay curious, keep testing, and always be on the lookout for new tools and techniques to enhance your site’s performance.
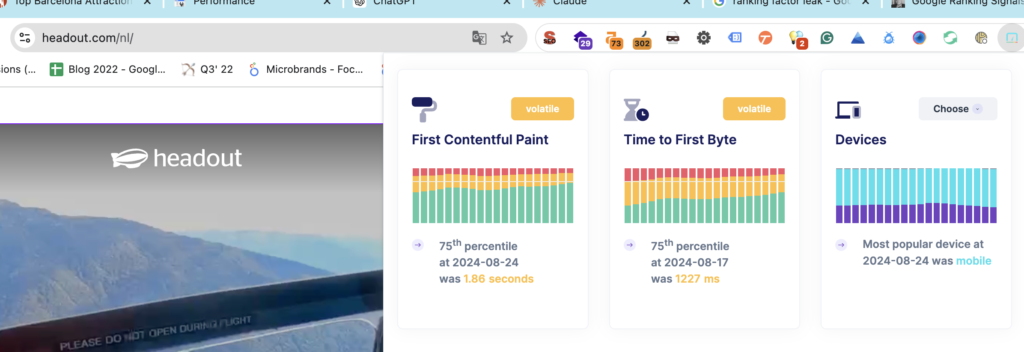
Results on Headout
Since most of this is publicly available data, I think I’m in the okay to publish this. Over the last 12 months, we’ve been trying to unlock our CDN capabilities. A new cache policy, monitoring hits vs misses. We have effectively got the P75 down from 1800ms to 1200ms which in turn got the FCP from 2.4s to 1.8s